|
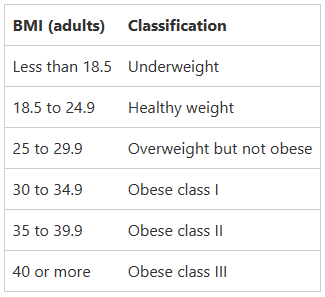
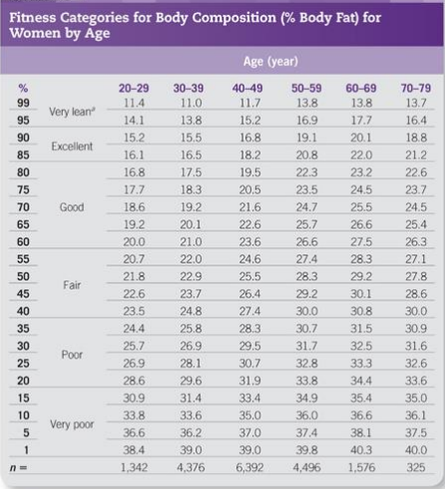
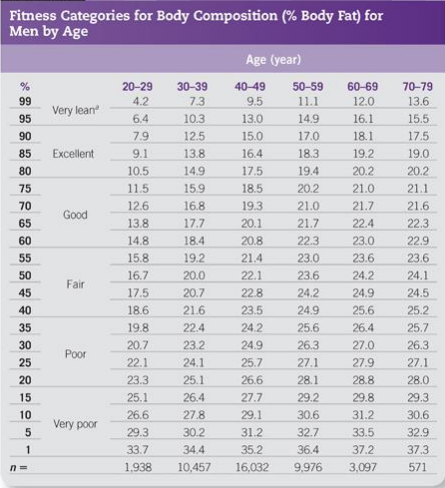
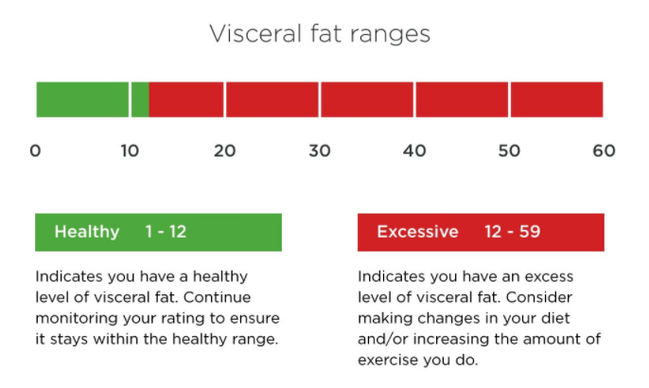
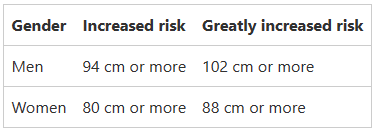
In Australia 67% of adults are overweight according to the AIHW, the Australian Government agency for health and welfare data. To repeat the significance in this statement, that is 2 out of 3 adults in Australia who have a BMI classed as overweight or obese. This factor alone has in the last decade been ranked as the number one cause of disease burden in Australia. Not only that the World Health Organisation has estimated that of all non-communicable diseases those related to overweight and obese populations make up around 90% of Australia’s deaths annually. If these aren’t immediately significant enough for you, I want to outline within this write up the importance of all the measurements you complete with an Exercise Physiologist and other health professionals, and a summary of some of the changes you can make to positively affect your physical health and wellbeing. What are the measurements you will have taken by an Exercise Physiologist? Body Mass “The weight of a person or thing is how heavy they are, measured in units such as kilograms, pounds, or tons.” BMI “Body Mass Index is a measure of body fat, that is the ratio of the weight of the body in kilograms to the square of its height in metres.” Body Composition “The different components (or "compartments") of a human body. The selection of compartments varies by model but may include fat, bone, water, and muscle.” Waist Circumference “The measurement around the narrowest point of the abdomen, or the midpoint between the lower border of the rib cage and the iliac crest. Used as an indicator for abdominal obesity.” What are the outcomes of each of these measurements? Body mass and BMI go hand in hand and as you can imagine, as the weight increases or decreases so does the number in the BMI score. The current trend for Australians is that we each gain an average of 300grams to 500grams with every year. Those increases yearly align with the rapid increases we’ve seen in our country the last 2 decades of overweight and obese individuals, again these have seen an increase of between 14% to 27% across different age brackets as recorded by AIHW. Having an overweight or obese BMI attributes to 30 diseases, including 17 types of cancers, 4 cardiovascular diseases, 3 musculoskeletal conditions, type 2 diabetes, dementia, asthma and chronic kidney disease. Here is a table of the classes of BMI for reference, with the healthy range being <25kg/m2. When recording body composition in our clinic the results measured include fat mass (both total fat mass and visceral fat), muscle mass, bone density, and body water to name a few. If your goal is weight loss than the figure you want to decrease is your fat mass. The other components such as muscle mass, bone density and body water can help flag and monitor other conditions such as osteoporosis, muscular atrophy, and more. When considering body fat here is a representation of what ranges are considered healthy: Within this component, there is increasingly more evidence supporting that the visceral body fat represents higher risks of cardiovascular and metabolic risks. This is the fat that is deposited around the organs. Independent of otherwise healthy organs, visceral body fat continues to present cardiovascular risk and metabolic risk when it makes up for >10% of the total body fat count. Here’s a guide on where these numbers should sit on the scale 0-59: When measuring waist circumference, the aim is to guide health professionals on risk levels associated with abdominal fat and total body fat that may be increased. The evidence surrounding measuring waist circumference for these risks is increasingly more valid for quantifying health risks; the current guidelines for these are below: In the previous decade in Australia, the trend for our waist circumference as we age is accelerating by 0.42cm every year, not dissimilar to the increase in weight discussed earlier. This makes for a compelling correlation. When looking at reliability of these measures, waist measurements applied with other data such as waist to hip ratio, waist to height ratio or coupled with a BMI score, these demonstrate a good strength of correlation coefficient of at least 0.82 across the board. The correlation being how strongly linked the result is to cardiovascular and metabolic risk factors, and scored from -1.00 to +1.00. What can be done to reduce your risk of illness if you are outside these healthy ranges?
At the risk of repeating everything you’ve heard from your doctors, family, friends, or out in society; increase your physical activity and change some of your eating habits. Specifically try meet these guidelines:
Thomas Harrison Accredited Exercise Physiolgist
0 Comments
Your comment will be posted after it is approved.
Leave a Reply. |
AuthorSLisa Parkinson Archives
July 2024
Categories
All
|

 RSS Feed